1. Summary
The Summary section contains a set of graphs that show short summary analytics for the entire customer base:
- Customer base quality (by months
- Customers
- Сustomer base quality dynamics
- Percentage of returning customers
- Assisted orders
The Summary reports are based on the customer data and purchase history received by the Loymax Smart Communications module from the Master System. It is recalculated four times per 24 hours.
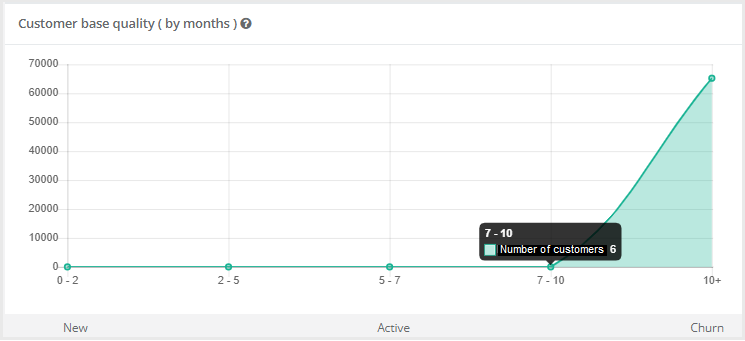
Customer base quality (by months)
The graph shows the distribution of the number of customers vs. time period since their last purchase. The time period for which this graph is calculated is set in the project settings. Usually a period of one year is used. The example on the right shows that the number of customers who made their last purchase between 7 and 10 months ago is 6. |  |
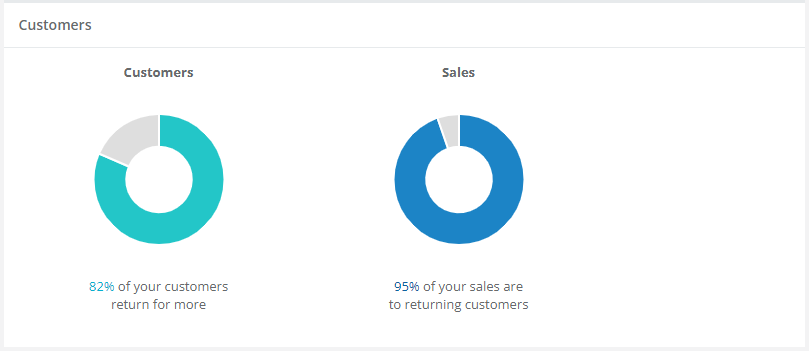
Customers
The chart illustrates the percentage of returning customers (who made two or more purchases) and their contribution to the revenue. The time period for which this chart is calculated is set in the project settings. As a rule, it equals to one year. Details are displayed when the cursor is pointed at the chart area. If customers have two or more receipts, they are considred to be returning customers by the System. Chart colors:
SalesThe System shows the revenue attributable to regular and returning customers:
|  |
Сustomer base quality dynamics
The graph shows the number of customers for the Best buyers and Lost buyers segments for the selected period by months.
|  |
Percentage of returning customers
The graph shows the percentage of customers (of the total number of customers in the database) who have two receipts or more for the selected period broken down by months. The exmaple on the right shows that 89% of all customers who made purchases in February 2021 are repeat customers. i.e. they have 2 or more receipts. |  |
Assisted orders
The chart shows the ratio of regular and assisted orders (by number of receipts or receipt amounts) for the selected period broken down by months. The example on the right shows the ratio of the number of receipts. To view the ratio of receipt amounts, click the Value tab. |
|
