RFM segmentation
RFM segmentation is a method used to analyze customer value.
RFM segmentation divides customers into three groups:
- Recency (limitation) – How much time had passed since the last purchase. The less time has passed, the more likely the customer will soon buy again.
- Frequency — The more often the customer buys, the more likely he/she will buy again.
- Monetary (monetary value) - The amount of transactions. The more money the client has spent, the more likely he/she is to spend more.
A score from 1 to 5 is assigned to each dimension. The maximum score represents the preferred behavior. All clients are divided into 5 equal groups.
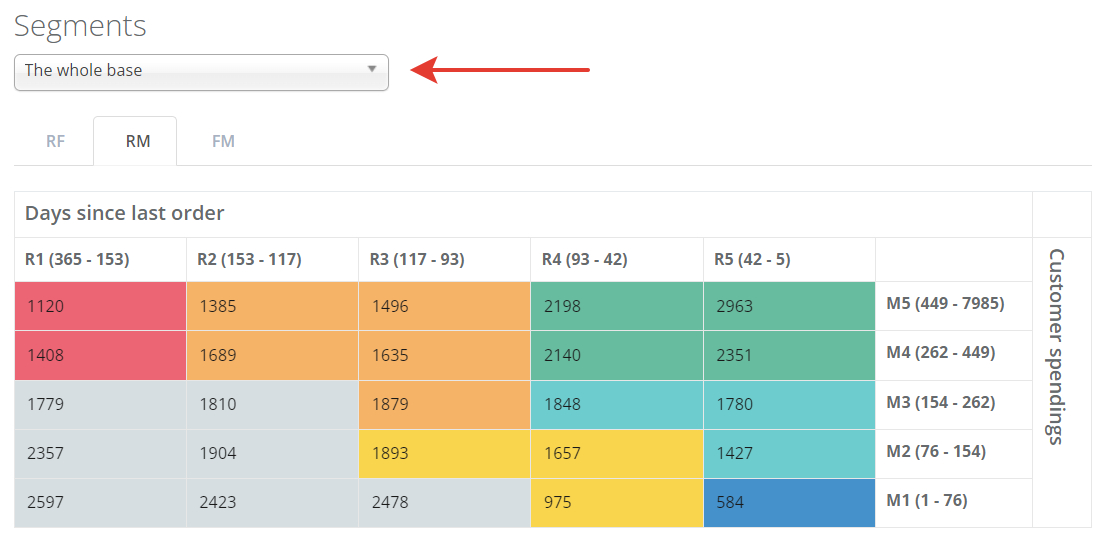
For example, M5 segment includes those customers who made purchases for a larger amount of money, M1 segment includes those who spent the least amount of money.
Viewing RFM Segments
Customers → RFM Segments section displays information on RFM segments. The page has 3 tabs:
- RF — data about how much time had passed since the last customer purchase (R) and the frequency of purchases (F).
- RM — data about how much time had passed since the last purchase (R) and amount of transactions (M).
- FM — data on the frequency of purchases (F) and the amount of transactions (M).
In the drop-down list (see below), you can select the segment on which the RFM will be calculated, for this you must create segment.
A cell in this table corresponds to one segment. For example, segment R5-M5 includes customers who made purchases for the sums from 449 to 7,985 USD, and the last purchase was made from 5 to 42 days ago.
In the table, the segments are highlighted in different colors. For example, the green color highlights loyal customers who buy often and the last purchase was recently. Those who bought little and a long time ago are highlighted in gray.
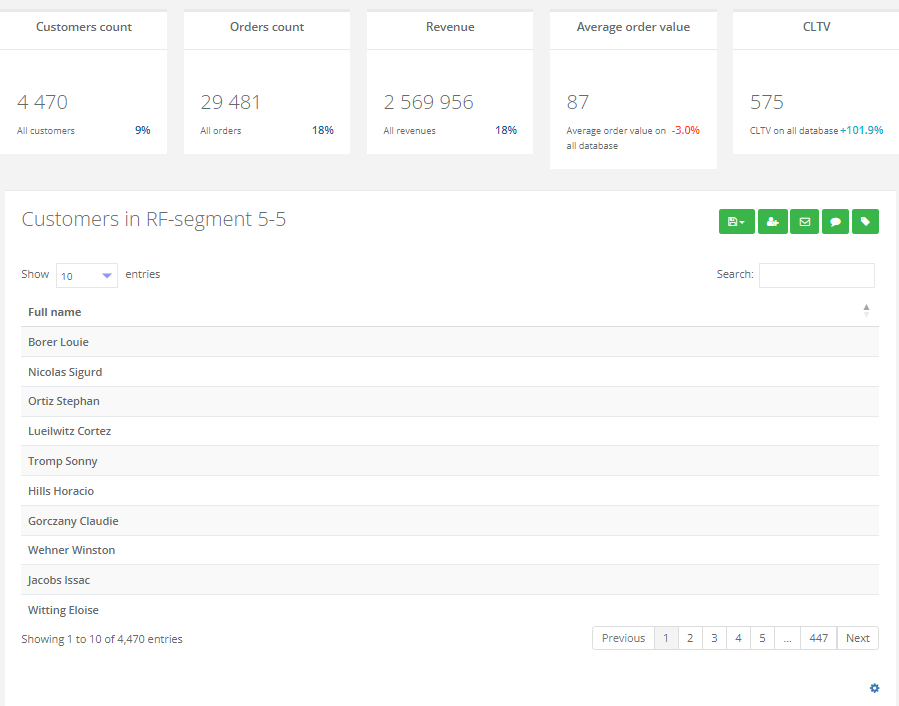
Clicking on a table cell displays segment information:
- Segment Metrics;
- List of customers in the segment.

